
Mass Exodus? Viral Post Says People Fleeing NoVa
A viral social media post claiming that hundreds of homes have hit the market in the D.C. area due to federal worker layoffs is completely false.
The post shows dozens of new listings in Arlington County and Falls Church, Virginia, and suggests that federal workforce cuts by Donald Trump and Elon Musk are triggering a mass sell-off in Northern Virginia.
I've had several clients reach out, asking, “What’s going on?”, “Is this true?”, and “Should I sell right now?”
But the facts don’t support the claim. Let’s look at the data from a macro view of the entire Washington, DC metro area and then zero in on Arlington.
DC Metro Area
Are there a flood of new listings in the DC Metro Area? Over 90% of home sales are entered into, Bright, the local Multiple Listing Service (MLS), so that gives us some reliable numbers.
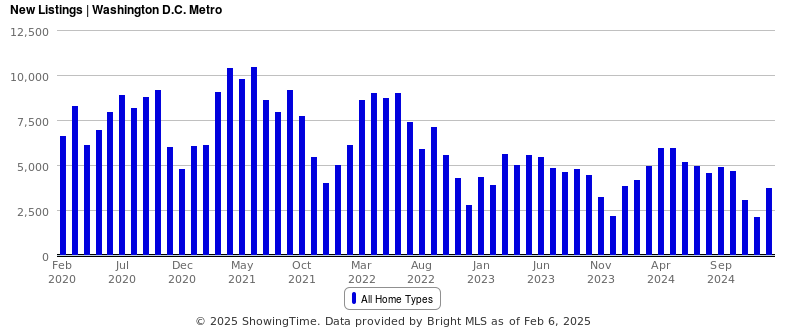
New Listings
Looking at the raw numbers for new listings in the DC Metro Area over a 5 year period, the number of new listings is actually lower than previous years. Real estate markets are seasonal and there is a distinct pattern throughout the year with the Spring market the busiest with the most listings and most activity.
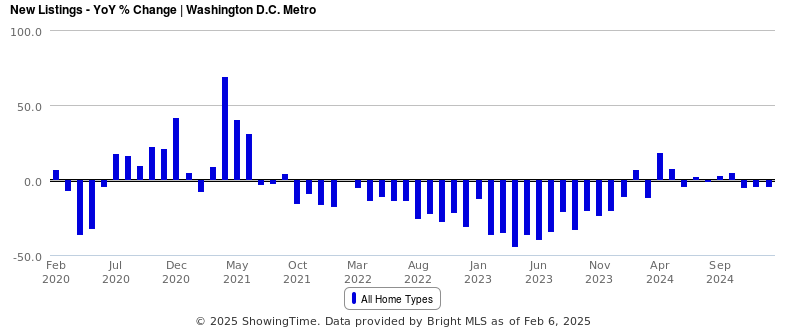
New Listings - YoY
Another way to look at the new listings data is the change from the year before. For the past few months, the number of new listings compared to the year before is actually down!
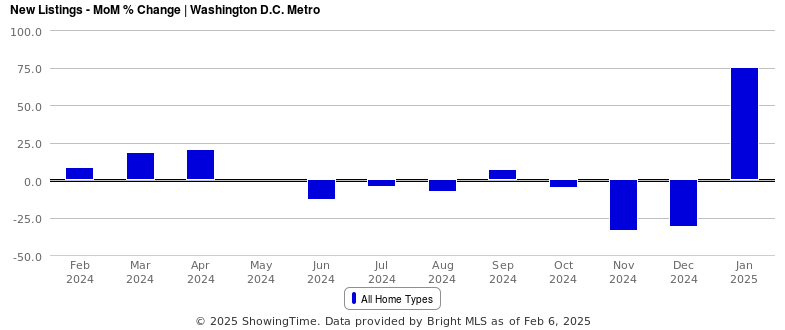
New Listings - MoM, 1 year
Now, if we look at the same data but compare it to the previous month, we see a 75% increase in the number of new listings. It's true! People are panic selling!
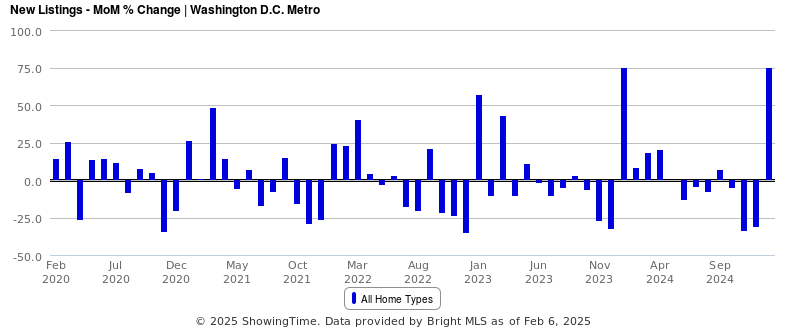
New Listings - MoM, 5 year
Now if we look at the month over month new listings over a 5 year period, we see a different picture. Did I mention real estate is seasonal? It turns out every January there is an increase in new listings compared to the month before, December. This is just the natural pattern of the market.

3 Types of Lies
My old statistics professor liked to say there are 3 types of lies:
-
Lies
-
Damn Lies
-
Statistics
The lesson is you can paint whatever picture you want if you present just a limited amount of data a certain way.
Condos in Arlington
The DC metro area is a pretty wide area with many submarkets. So what do the numbers for new listings in Arlington look like? How about just condos in Arlington?
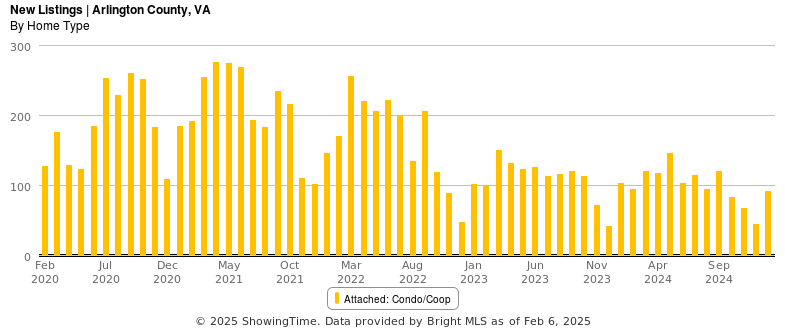
New Listings
Looking at the raw numbers for new condo listings in Arlington, the pattern is very similar to the overall DC Metro Area over a 5 year period. The number of new listings is about the same as last year and is lower than previous years.
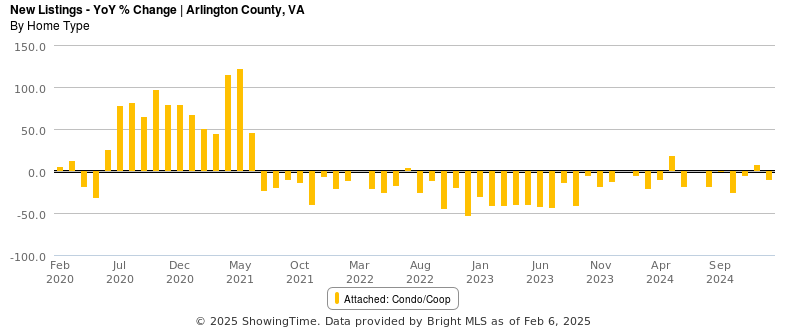
New Listings - YoY
For the same data but looking at the year-over-year change, the number of new listings compared to the year before is actually down, just like in the greater DC Metro Area.
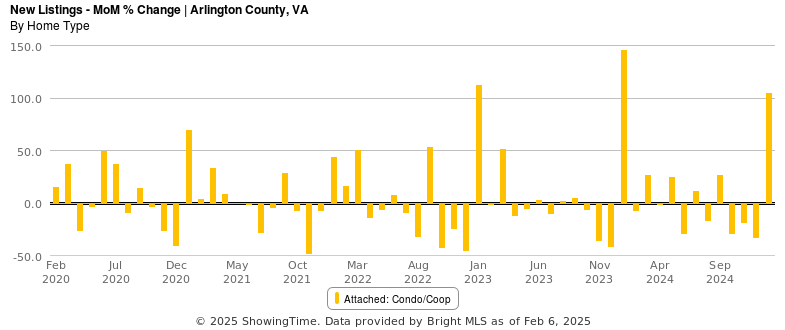
New Listings - MoM
Now, if we look at the same data but compare it to the previous month, we see the same seasonal spikes in January. No surprise, many sellers wait until after the holidays to put their place on the market.


